


- Ethereum Price Analysis: Can ETH Reclaim $2,700 This Week?
- LiquidChain Targets Cross-Chain Liquidity as Ethereum Tests Support
Ethereum is trading at $2,500, down 2.5% over 24 hours. That drop puts ETH damaged from a sharp retreat below resistance. The key question for this Ethereum price analysis is whether buyers can defend the next support band or whether the market is headed lower.
Institutional demand has been a headwind. U.S. spot Ethereum exchange-traded funds (ETFs) recorded about $161 million in net outflows in the latest reported session, extending the streak to seven days; BlackRock’s ETHA accounted for approximately $116 million.
Discover 800+ Trading Pairs You Can Trust With Kraken
Ethereum Price Analysis: Can ETH Reclaim $2,700 This Week?
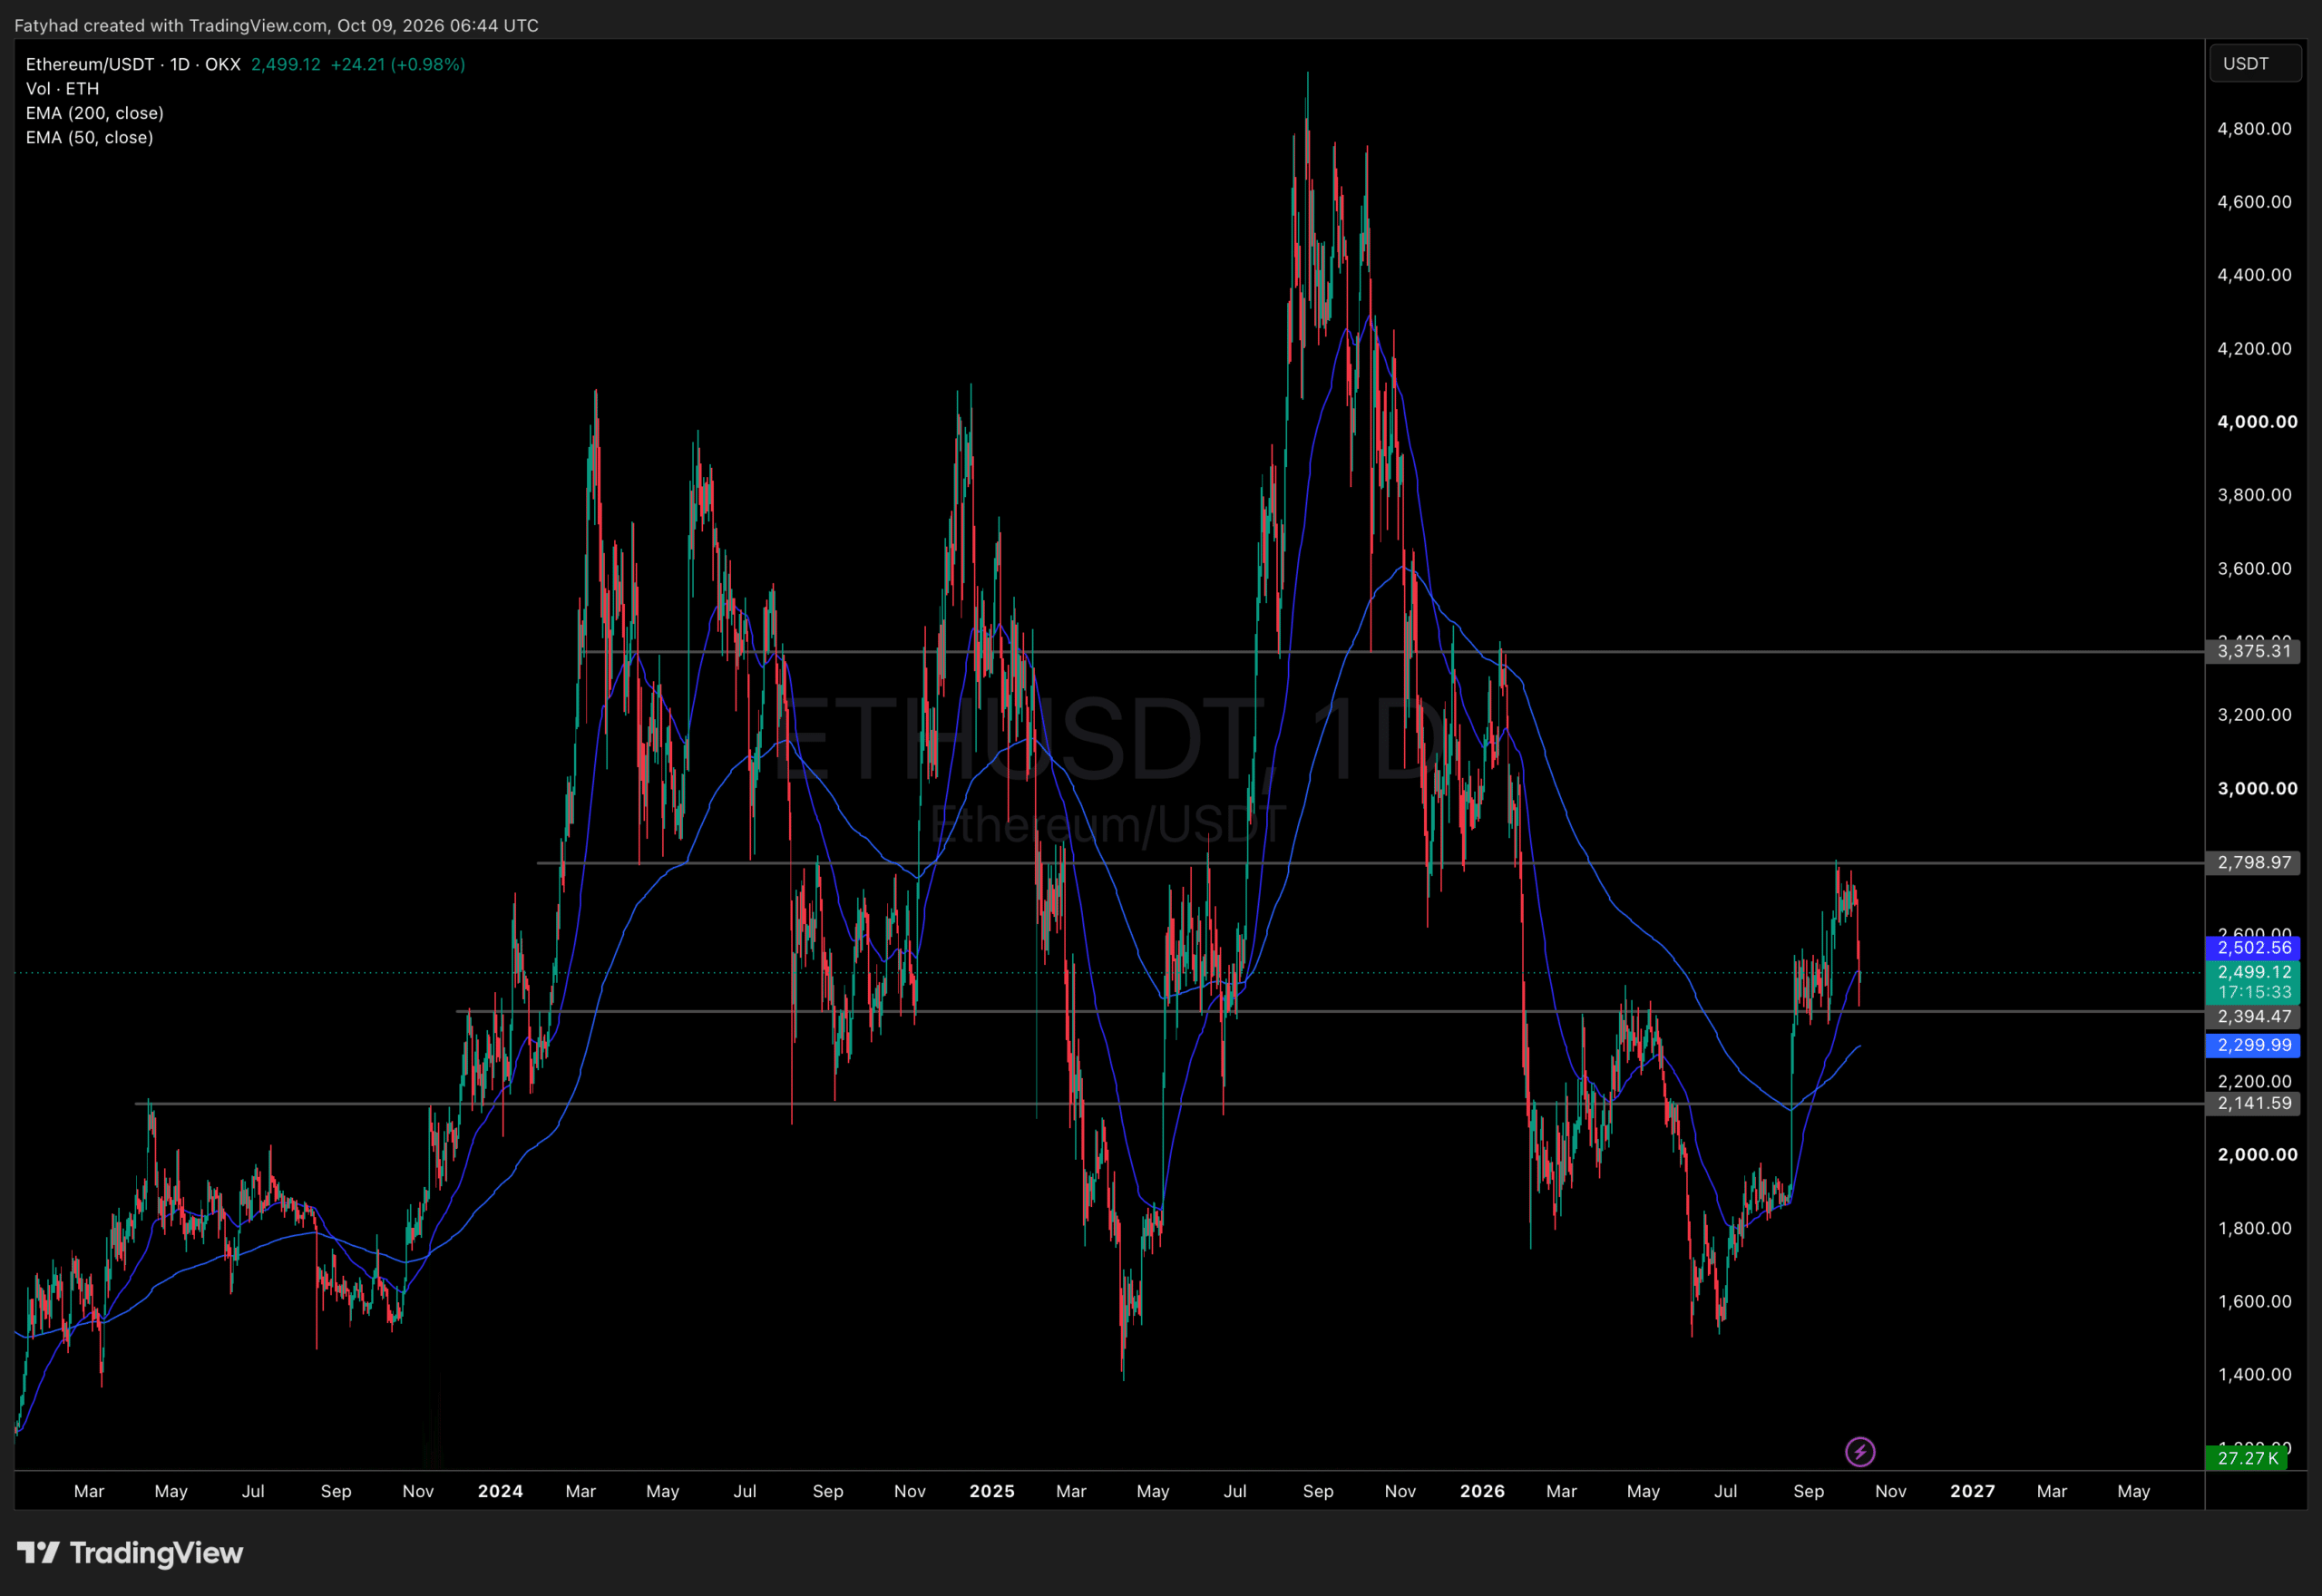
At $2,502.96, ETH is up 1.13% on the day and sitting right on immediate resistance near $2,500, which also matches the 50-day EMA at $2,502.71. The price had lost about 8.5% over the past week and logged three straight losing days before this bounce.
The near-term support map starts around $2,470, close to yesterday’s $2,474.91 close, then runs through $2,440–$2,410 and $2,394.47, the horizontal level marked on the daily chart. A break below $2,400 could expose approximately $2,357, inside the broader $2.36K–$2.42K demand zone. The 50-day EMA sits above the 200-day EMA at $2,300.02, which keeps the longer-term setup constructive. The daily relative strength index (RSI), a momentum indicator, was near 44, below neutral.
- Bull case: If support holds and ETH clears $2,546, the short-term structure could improve. The next resistance area is $2,650–$2,700, and the recent swing high near $2,799 sits above that.
- Base case: If price stabilizes near $2,470–$2,500, consolidation is the more measured outcome.
- Bear case: A sustained loss of $2,400 would weaken the constructive view and put $2,357 and the 200-day EMA near $2,300 in play.
A weekly close above $2,800 would be a stronger bullish signal, not a given. For additional technical context, see this Ethereum price analysis of the $2,800 level.
DISCOVER: Best Meme Coin ICOs to Invest in 2026
LiquidChain Targets Cross-Chain Liquidity as Ethereum Tests Support
ETH’s retreat has put short-term holders under pressure, and persistent ETF withdrawals add a demand-side concern. That is the uncomfortable backdrop: when a major asset is struggling to hold a key level, traders often look beyond the largest tokens. So, where might we spot a trade that’s a bit riskier but could bring in more profit?
LiquidChain is a Layer 3 (L3) infrastructure project that says it fuses Bitcoin, Ethereum, and Solana liquidity into one execution environment. Its stated features include a Unified Liquidity Layer, Single-Step Execution, Verifiable Settlement, and a Deploy-Once Architecture: developers deploy once and can access all three ecosystems.
The project lists a current price of $0.014963 and a total raised of $982,340. Staking annual percentage yield (APY) is live at an insane 1,169% for early investors. Readers considering the project can research LiquidChain and review its mechanics before deciding.
DISCOVER: 15+ Upcoming Coinbase Listings to Watch in 2026
Follow 99Bitcoins onXFor the Latest Market Updates and Subscribe onYouTubeFor Daily Expert Market Analysis.
Why you can trust 99Bitcoins
Established in 2013, 99Bitcoin’s team members have been crypto experts since Bitcoin’s Early days.
Follow 99Bitcoins on your Google News Feed
Get the latest updates, trends, and insights delivered straight to your fingertips. Subscribe now!
Subscribe now
In This Article
- Ethereum Price Analysis: Can ETH Reclaim $2,700 This Week?
- LiquidChain Targets Cross-Chain Liquidity as Ethereum Tests Support
Free Bitcoin Crash Course
- Enjoyed by over 100,000 students.
- One email a day, 7 days in a row.
- Short and educational, guaranteed!
