


Bitcoin Price Analysis: Aggressive Weekly Breakdown Targets $57,800 Liquidity
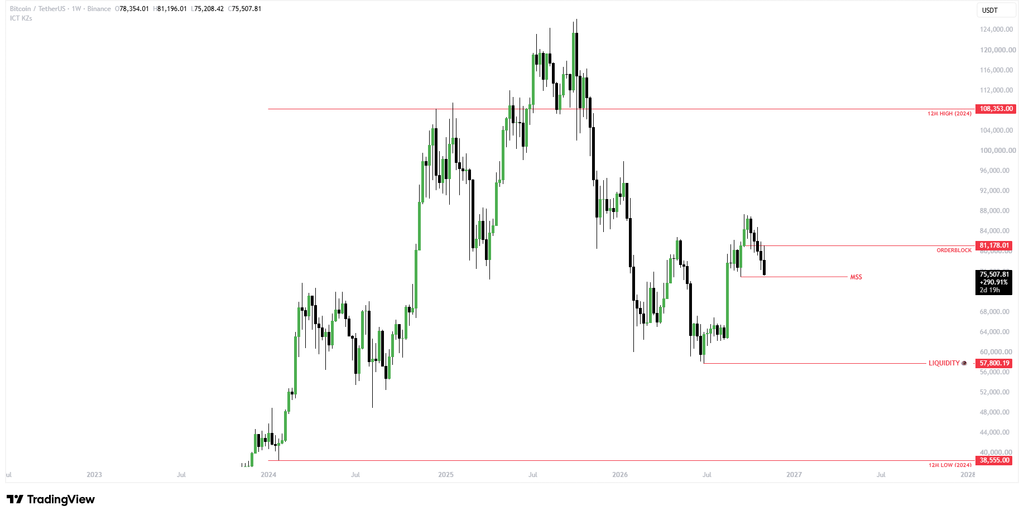
Bitcoin is approaching a critical support level around $75,500. A weekly close below this level confirms a bearish breakdown and opens the door to further downside toward $57,800. In other words, the $75,500 support level is now the key battleground for buyers and sellers.
Bitcoin Struggles Below $81,178 Resistance
Bitcoin is trading around $75,507 after failing to extend its recovery toward $87,000. The cryptocurrency has also struggled to regain upward momentum since reaching its previous cycle high above $120,000 in 2025.
One major obstacle remains the $81,178 resistance zone. Bitcoin recently faced rejection at this level, highlighting persistent selling pressure. $BTC is now testing support around $75,500. Buyers must defend this level to prevent a deeper correction.
Know when your
coins move
Alerts, real-time prices, and market news — all in one app
Point your phone camera to install
4.8 based on 40K reviews in the App Store and Google Play
Breakdown Below $75,500 Targets $57,800
The chart identifies $57,800 as a major liquidity level and the next downside target. A weekly close below $75,500 confirms the breakdown and places Bitcoin on a path toward $57,800. This represents a potential decline of 23.4%.
Several support levels stand between the current price and the downside target:
- $75,001: Fibonacci support highlighted in Reuters’ November 4 analysis.
- $73,188: The 200-day moving average.
- Above $62,000: Previous price lows providing additional support.
- $57,800: The major downside liquidity target.
An intraday move below $75,500 does not confirm a breakdown. The decisive signal is a weekly candle closing beneath this support level. A recovery above $75,500 before the weekly close signals that buyers are defending the support zone.
Bitcoin Must Reclaim $81,178
On the other hand, Bitcoin needs to reclaim $81,178 to reverse its immediate bearish outlook. A decisive move above this resistance weakens selling pressure and gives $BTC room to resume its recovery.
However, previous rejection at this level highlights the strength of the resistance zone. The chart also shows Bitcoin trading below its marked 12-month high of $108,353, while its 12-month low stands at $38,555.
Market Conditions Increase Selling Pressure
Bitcoin’s recent decline coincides with weakness in the cryptocurrency market. Glassnode’s November 2 report highlighted elevated futures open interest and aggressive leveraged long positions, indicating that traders remained heavily positioned for higher prices.
On November 6, Bitcoin fell toward $75,000 as weakness in technology stocks and leveraged liquidations intensified selling pressure. These market conditions increase the importance of the $75,500 support level and raise the risk of further downside.
What Happens Next?
Bitcoin’s next major move hinges on its reaction around $75,500.
- Bearish scenario: A weekly close below $75,500 triggers a bearish breakdown, putting $73,188 and the support region above $62,000 in focus before the major $57,800 liquidity target.
- Bullish scenario: A recovery above $81,178 weakens the bearish structure and signals renewed buying pressure.
At the moment, $75,500 remains Bitcoin’s most important immediate support level. A weekly breakdown shifts market attention toward $57,800, while a successful defense of support keeps the recovery scenario alive.
