

Bitcoin Price Analysis: BTC Reclaims Major Moving Averages as Bulls Target $90K Resistance
Bitcoin is trading around $84K after a strong recovery from the $60K area over the past couple of months. The charts show that BTC has moved back above its major moving averages, while the shorter-term structure remains constructive but capped by a clear supply zone. Meanwhile, adjusted SOPR has recovered above 1, suggesting that realized profitability is improving.
Bitcoin Price Analysis: The Daily Chart
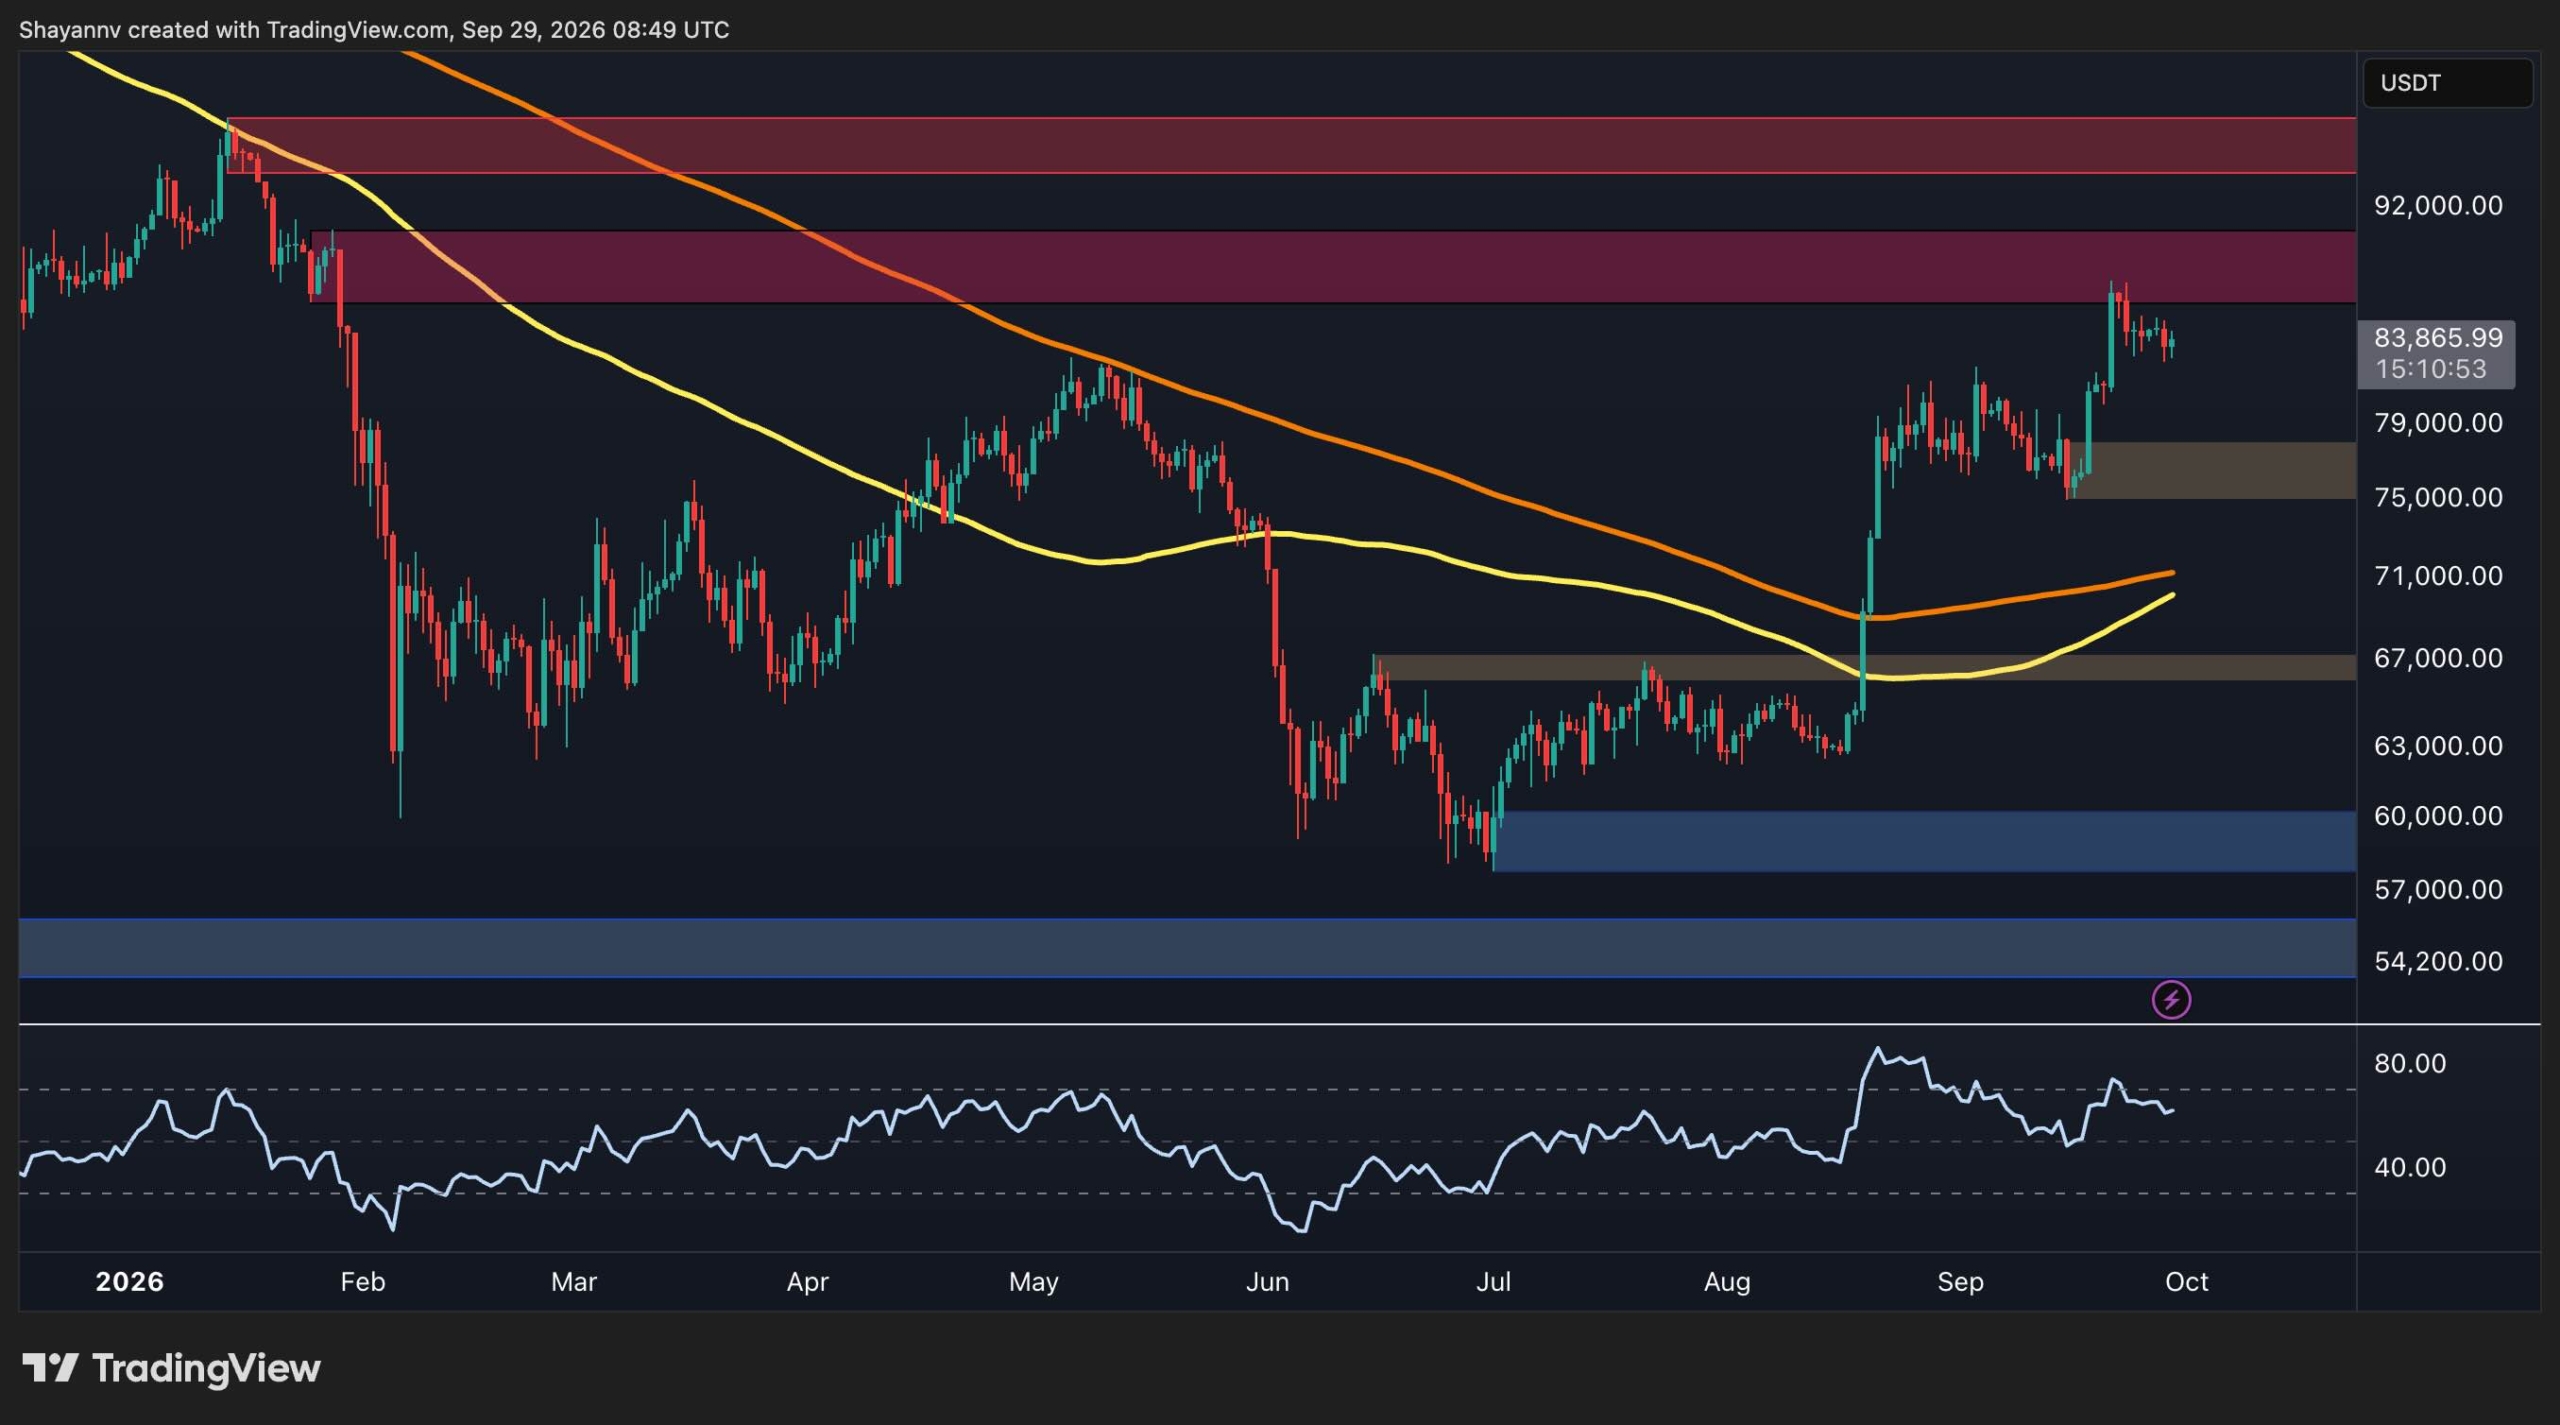
The daily chart shows a significant structural recovery from the $60K demand area. BTC subsequently reclaimed the $67K resistance zone and broke sharply higher in August, moving above both the 100-day and 200-day moving averages with force.
The 200-day moving average is currently around $71K, and the 100-day moving average is converging from below near $70K. Both are below the current market price, have begun turning higher, and are on the verge of a potential bullish crossover, which keeps the broader structure constructive. The previous resistance around $67K has therefore shifted into an important structural support area.
After the August breakout, BTC established another consolidation zone around $75K-$80K before pushing toward the $88K region. That $75K-$80K area remains the nearest major daily support zone, while the $67K region represents a deeper structural support.
The main obstacle is overhead supply. The first major resistance zone is roughly at $88K-$90K, followed by the higher supply area around $95K. BTC would need to reclaim these zones to extend the current recovery beyond the $100K mark and potentially toward new all-time highs.
BTC/USDT 4-Hour Chart
The 4-hour chart provides a more immediate view of the current consolidation. BTC made a sharp move from the $75K region through the $82K area and subsequently accelerated toward the $86K resistance level.
Since reaching that area, price has been rejected and is now consolidating near $83K. The bullish order block near the $80-$82K zone is the key near-term demand area, and it has already acted as a base following the breakout.
On the upside, the $86K-$90K region is the immediate supply zone. The price has already tested this area and failed to establish a sustained breakout, leaving it as the main hurdle for continuation.
Still, the 4-hour RSI is around 50 after recovering from lower levels. This suggests that short-term momentum has stabilized rather than becoming excessively stretched, but is yet to show a bullish shift.
A strong move above $86K would put the upper part of the supply zone in focus, while a breakdown below $80K would weaken the current short-term structure and increase the possibility of a deeper retracement toward the $75K area.
On-Chain Analysis
The adjusted SOPR chart shows a notable improvement in Bitcoin’s on-chain profitability conditions. Adjusted SOPR measures whether coins being spent are, in aggregate, being moved at a profit or loss, with a value above 1 indicating that profitable spending is dominating.
The metric has recently climbed back above the 1.0 level, and its 30-day exponential moving average is currently around 1.01 after spending much of 2026 below 1.
This recovery coincides with BTC’s move from roughly $60K toward the current $84K level. The improving aSOPR therefore supports the idea that the recent price recovery is accompanied by improving realized profitability rather than occurring while the metric continues to deteriorate.
However, the current reading remains only modestly above 1. The metric has not reached the significantly higher levels seen during previous strong advances. Therefore, the on-chain data currently suggests improving conditions, but does not by itself confirm another major expansion in the trend. Still, this points to the fact that the market participants are once again realizing profits, which reduces the immediate fears of panic selling flooding the market with excess supply and leading to further capitulations and crashes.
Disclaimer: Information found on CryptoPotato is those of writers quoted. It does not represent the opinions of CryptoPotato on whether to buy, sell, or hold any investments. You are advised to conduct your own research before making any investment decisions. Use provided information at your own risk. See Disclaimer for more information.
